| Bookmark Name | Actions |
|---|
Reports
Users with appropriate access permissions can use this feature to view the reports generated in Spotlight. These reports help in monitoring and analyzing the data based on which one can take appropriate business decision.
Menu path: Reports and Logs > Reports
You can do the following from the Reports section:
Reports is a feature which has got its own set of permissions for the actions you can do in this feature. A user with respective permission can perform only those activities. Following is the list of permissions associated with this feature:
- Add/Remove Data Source - Users with this permission can add or remove a data source.
- Create Report - Users with this permission will have the capability to create reports.
- Share Report - If users want to share the report that they have created, then they must have this permission.
- Download Report Data - If users want to download the created or shared report, then they must have this permission.
NOTE: For the purpose of this document, it is assumed that the user has permissions to all the actions.
Messages
The app displays the daily volume of messages coming in and going out over the reporting period , and the average age of a thread for the specified period out of the box. This data is generated based on the activity and updates in the Messages module.
Menu path: Reports and Logs > Reports > Messages Report
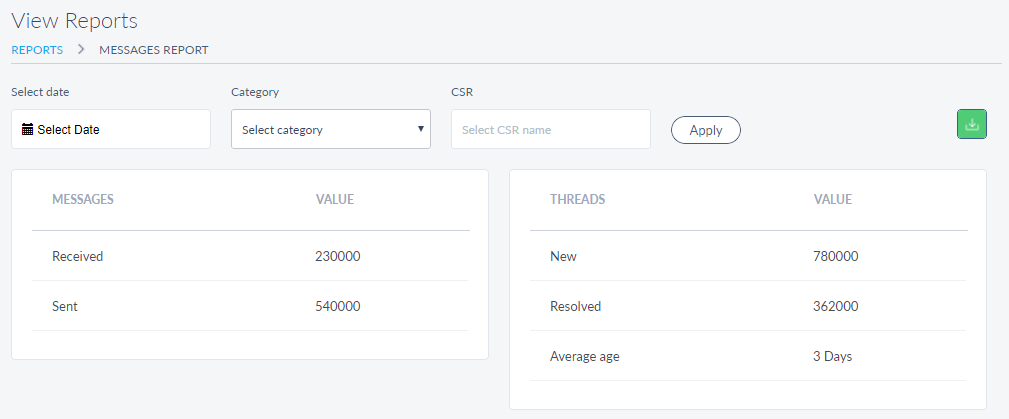
You can apply any of the following filters to get the required message report:
- Select Date: Select the required date range from the date picker and apply it. You can also select and apply the available time periods:
- Specific date (by default present day is selected)
- Last 7 days
- Last 15 days
- Last 30 days.
- Category: Select the required category from Category list for which you the messages report.
- CSR: Enter the key word (username) in part or full to get the message report related to specific representative.
The report is represented in the form of rows with following details: Messages, and Value. Messages display the number of individual messages received and sent in a specific time period.
The app also displays the message report for number of new and resolved threads with average age of the thread. The average age of a thread is calculated from the date when that thread was first created by the customer till the date when the last message was sent in that thread.
You can download  the report in the form of excel file if required.
View Generated Report
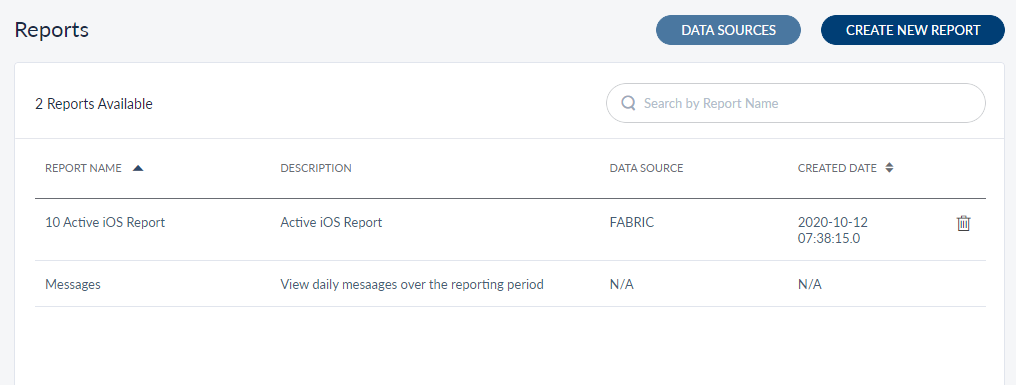
The Reports landing page displays the list of reports that are already generated.
Following is the information displayed about each report:
- Report Name - Name of the report.
- Description - A short description explaining the purpose of the report.
- Data Source - The name of the data source used to generate the report.
- Created Date - The date on which the report was created.
You can sort the list based on Report Name or Created Date columns by using the sort icon (
 denotes sorted by that column). You can also filter
 the list by Data Source. You can search for the required report using the Search feature. Enter the name or required key word related to a report in the Search field. The app displays the list of reports matching the search criteria.
If you want to delete a report from the list, click the delete icon of the respective report.
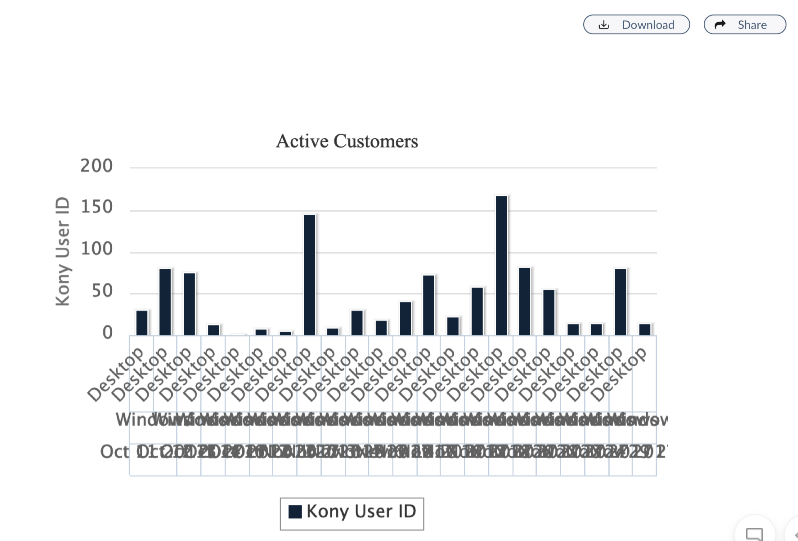
Click on the required report row to view the report. The related report screen appears.
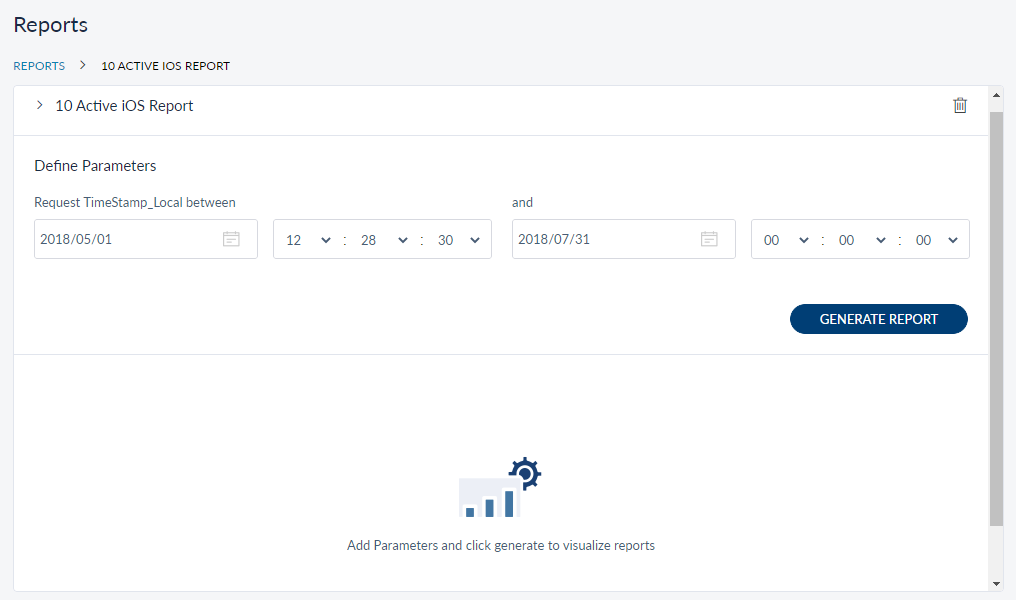
Do the following to visualize the selected report:
- In the Define Parameters section, provide the details about the parameters shown. These parameters vary for each report based on the type of report you want to view. Defining these parameters act as a filter for the report and the visual view of the report is created based on those parameters.
- Click Generate Report. The visual view of the report is displayed.

- If required you can download the report or share it with another user.
Share Report
When you create a report only you can view it and share the generated report with other users. You can share the report to a specific role or to an individual user. When you share a report with a specific role, all the users assigned with that role can view the report.
NOTE: The report can be shared by only that person who created it. Make sure that the user with whom you want to share the report has permission to access the Report feature.
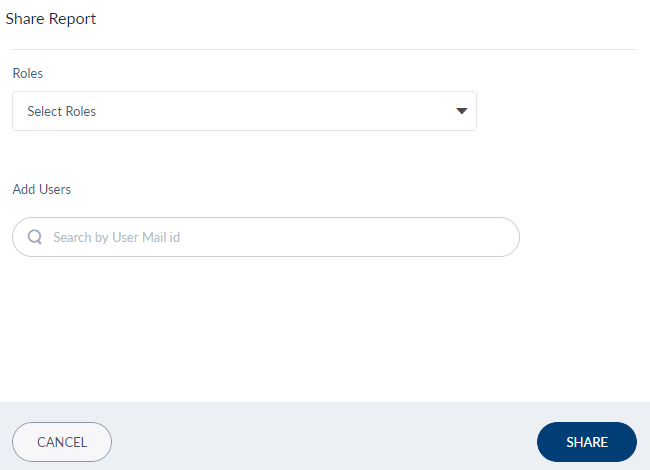
Do the following to share the report:
- On the reports visualize screen, click Share. The Share Report screen is displayed.
- If you want to share the list with specific role, from the Roles list, you can select the required roles.
- If you want to share the list with specific users, from the Search by User Mail id field, add the required users.
- Click Share.
Create Report
From the Reports landing page, click Create Report. The Create Report screen appears.
Following are the sections which you have to configure to create a report:
- Data Source
- Reports
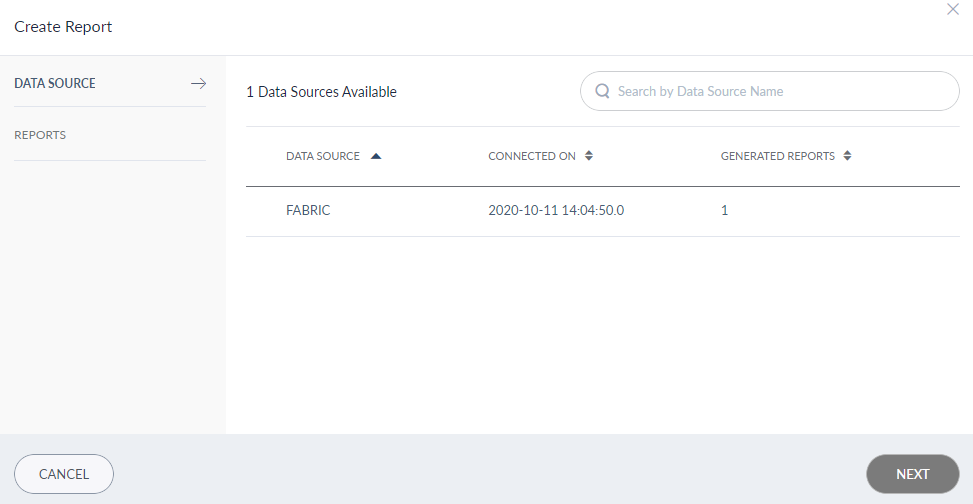
Data Source
The Data Source tab displays the list of data sources that are connected to Spotlight with the following information:
- Data Source name
- The date on which the data source was connected to Spotlight.
- Number of reports generated in Spotlight using that data source.
NOTE: For this release, Fabric is the only data source that you can connect to using Spotlight. It is available out of the box from the date you install Spotlight.
Click Next. The Reports tab appears.
Reports
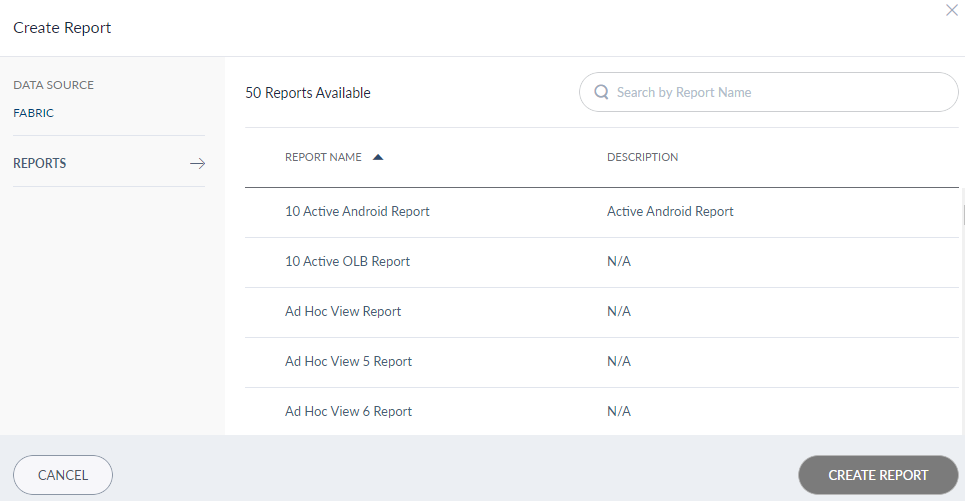
From the Reports tab, you can view the list of reports that are available in the selected data source. You can also use the search option to filter the required report. Select the required Report and click Create Report. The report is added to Spotlight.
NOTE: As Fabric is the only data source available, the Reports section lists all the reports available in Fabric. Make sure that the report that you want to visualize in Spotlight is already created in Fabric. To know more about creating reports in Fabric, refer to Custom Reports.
View Data Sources
Use this feature to view all the data sources that are linked to Spotlight. Click Data Sources from the Reports landing page.
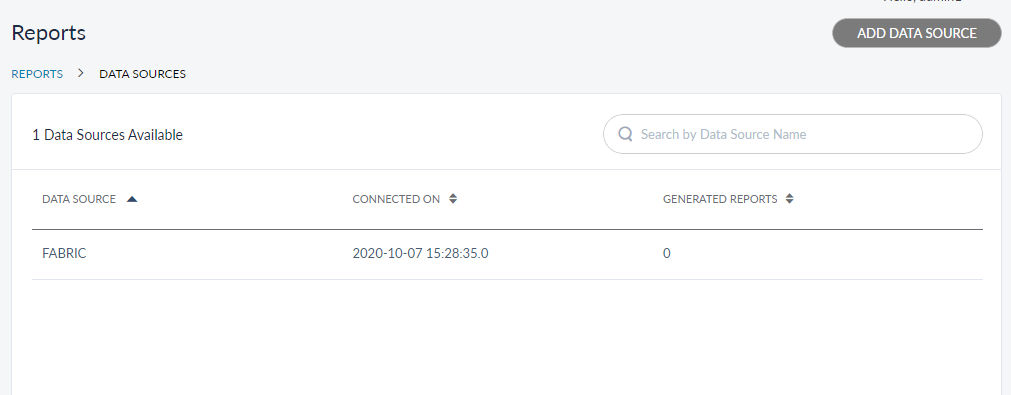
The list of data sources is displayed with the following information:
- Data Source name
- The date on which the data source was connected to Spotlight.
- Number of reports generated in Spotlight using that data source.
You can add a new data source from this page by clicking Add Data Source.
NOTE: As Fabric is the only data source that Spotlight supports in this release, the Add Data Source option is disabled.
Experience APIs
| Experience API | Description |
|---|---|
| GetTransactionValueVolumeByTransactionType | This service is used to fetch the total money value based on transaction type (service type) and type (domestic and international). |
| GetTransactionValueVolumeByService | This service is used to fetch the transaction value for different services along with the volume. |
| getDataSources | This service is used to fetch saved data sources. |
| shareReport | This service is used to share the report to given users and roles. |
| getReportsList | This service is used to fetch accessible reports for current user. |
| createReport | This service is used to create a report. |
| deleteReport | This service is used to delete a report. |
| getFabricReports | This service is used to fetch list of reports from fabric. |
| getReportFilters | This service fetches filters available from fabric for a given report. |
| getReport | This service is used to view the report. It returns a HTML string for a report to be displayed. |
| downloadReport | This service is used to download the report. It returns report in the format specified. |
Add Bookmark
save your best linksView Bookmarks
Visit your best links BACK
BACK


Are you sure you want to log-off?